Multiple Choice
Table 15-1
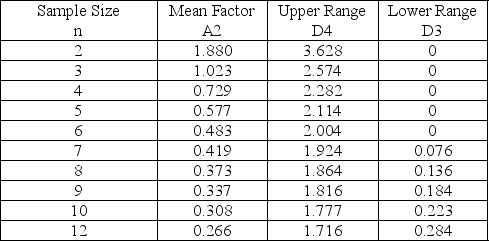
-Use the data shown below and the information in Table 15-1 to develop an upper control limit for a control chart that monitors central tendency.What is the upper control limit? 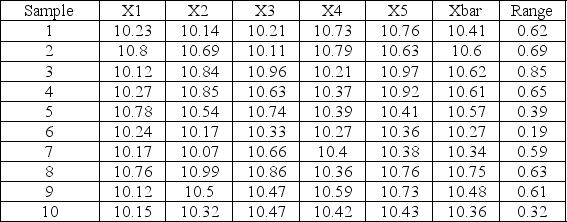
A) 0
B) 1.17
C) 10.82
D) 11.99
Correct Answer:

Verified
Correct Answer:
Verified
Q18: If all of the control points on
Q19: A quality control program is being developed
Q20: A company has been receiving complaints about
Q21: Robert Pirsig defines quality as "Fitness for
Q22: Table 15-1<br> <img src="https://d2lvgg3v3hfg70.cloudfront.net/TB5481/.jpg" alt="Table 15-1
Q24: The area from two standard deviations above
Q25: Which of the following control charts is/are
Q26: Explain the difference between an x-bar chart
Q27: A company has been receiving complaints about
Q28: The inspection of cans of juice involves