Essay
Table 15-1
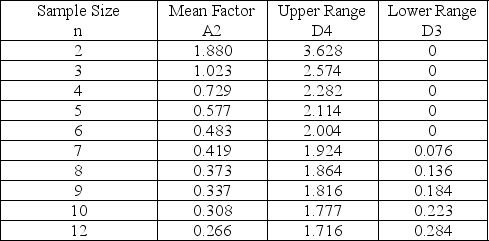
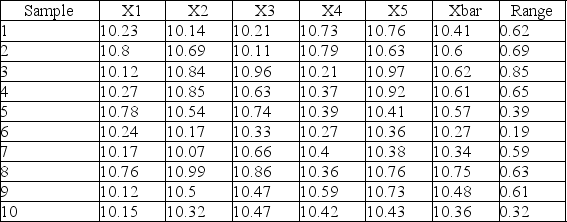
-Use the data shown below and the information in Table 15-1 to develop a control chart that monitors consistency.Use your chart to make an assessment - is the process in control?
Correct Answer:

Verified
Rbar = 0.554, so UCLR = 1.171 ...View Answer
Unlock this answer now
Get Access to more Verified Answers free of charge
Correct Answer:
Verified
View Answer
Unlock this answer now
Get Access to more Verified Answers free of charge
Q55: Samaje studied his control chart and noticed
Q56: Which of these patterns on a control
Q57: Defects in the finish of new, custom
Q58: Variations that usually occur in a process
Q59: Statistical process control uses regression and other
Q61: The U.S.government awards for quality achievement are
Q62: An airline company tracks the number of
Q63: A p-chart could be used to monitor
Q64: Table 15-1<br> <img src="https://d2lvgg3v3hfg70.cloudfront.net/TB5481/.jpg" alt="Table 15-1
Q65: Leo Phan is the new business manager