Multiple Choice
Table 15-1 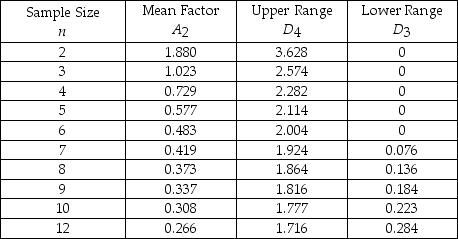
-Refer to Table 15-1.Bags of chocolate candy are sampled to ensure proper weight.The overall average for the samples is 36 ounces.Each sample contains eight bags.The average range is 1.3 ounces.The lower control chart limit for the sample averages would be
A) 36.3730.
B) 36.4849.
C) 35.6270.
D) 35.5150.
E) None of the above
Correct Answer:

Verified
Correct Answer:
Verified
Q14: The underlying distribution for a p-chart is
Q51: Which of the following statements is FALSE
Q52: A(n)_ chart is appropriate to monitor the
Q53: If we wish to monitor the average
Q58: Table 15-2<br>Given the sample results (100 units
Q59: Which of the following control charts is/are
Q60: _ introduced control charts in 1924.
Q61: The U.S.government awards for quality achievement are
Q61: Table 15-1 <img src="https://d2lvgg3v3hfg70.cloudfront.net/TB2950/.jpg" alt="Table 15-1
Q63: A p-chart could be used to monitor