Multiple Choice
Table 15-1 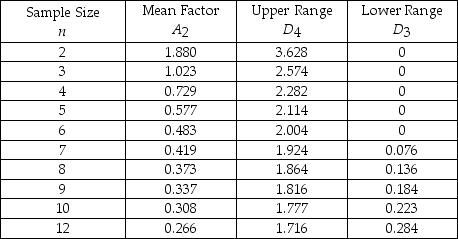
-Refer to Table 15-1.Bags of tea are sampled to ensure proper weight.The overall average for the samples is 8 ounces.Each sample contains 10 bags.The average range is 0.1 ounces.What is the lower limit of the sample averages chart?
A) 7.9692
B) 8.0308
C) 7.9076
D) 8.0924
E) None of the above
Correct Answer:

Verified
Correct Answer:
Verified
Q9: Explain the difference between control charts for
Q14: The underlying distribution for a p-chart is
Q52: If we are tracking quality of performance
Q56: Table 15-1 <img src="https://d2lvgg3v3hfg70.cloudfront.net/TB2950/.jpg" alt="Table 15-1
Q58: Table 15-2<br>Given the sample results (100 units
Q59: Which of the following control charts is/are
Q60: _ introduced control charts in 1924.
Q62: Which of the following control charts is/are
Q65: Which of the following is not a
Q66: <img src="https://d2lvgg3v3hfg70.cloudfront.net/TB2950/.jpg" alt=" -charts indicate changes