Multiple Choice
Table 15-2
Given the sample results (100 units in each sample) : 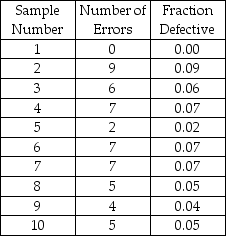
-Based on Table 15-2,find the 95.5% lower limit of the appropriate p-chart.
A) 0.0076
B) 0.0964
C) 0.2014
D) 0.1397
E) None of the above
Correct Answer:

Verified
Correct Answer:
Verified
Q9: Explain the difference between control charts for
Q14: The underlying distribution for a p-chart is
Q53: If we wish to monitor the average
Q56: Table 15-1 <img src="https://d2lvgg3v3hfg70.cloudfront.net/TB2950/.jpg" alt="Table 15-1
Q59: Which of the following control charts is/are
Q60: _ introduced control charts in 1924.
Q61: The U.S.government awards for quality achievement are
Q61: Table 15-1 <img src="https://d2lvgg3v3hfg70.cloudfront.net/TB2950/.jpg" alt="Table 15-1
Q62: Which of the following control charts is/are
Q63: A p-chart could be used to monitor