Multiple Choice
Use the data shown below to answer the following question(s) .
Captain Jack Automobiles launched a new car and tabulated the below data for the new launch. 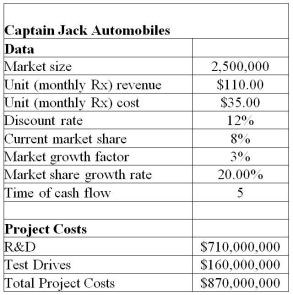 The project manager identified the following distributions and parameters for these variables:
Market size: normal with a mean of 2,000,000 units and a standard deviation of 400,000 units
R&D costs: uniform between $639,000,000 and $781,000,000
Test Drives: lognormal with mean of $160,000,000 and standard deviation $16,000,000
Annual market growth factor: triangular with minimum = 2%,maximum = 6%,and most likely = 3%
Annual market share growth rate: triangular with minimum = 15%,maximum = 25%,and most likely = 20%
Use 5,000 trials to generate the simulation model using Crystal Ball.
-The NPV to be generated from the data given above is called a(n) ________.
A) decision cell
B) assumption cell
C) bootstrap cell
D) forecast cell
Correct Answer:

Verified
Correct Answer:
Verified
Q9: Use the data set shown below to
Q10: What is the Batch Fit Tool in
Q11: In the forecast chart for the cumulative
Q12: Latin Hypercube sampling differs from Monte Carlo
Q13: Why is sampling from empirical data not
Q15: Running the Tornado Charts tool before the
Q16: What is Monte Carlo simulation?<br>A)It is the
Q17: Use the data shown below to answer
Q18: Risk analysis seeks to examine the impacts
Q19: Optimum consulting is concerned about the maximum