Multiple Choice
Use the data shown below to answer the following question(s) .
Captain Jack Automobiles launched a new car and tabulated the below data for the new launch. 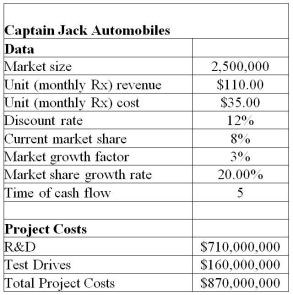 The project manager identified the following distributions and parameters for these variables:
Market size: normal with a mean of 2,000,000 units and a standard deviation of 400,000 units
R&D costs: uniform between $639,000,000 and $781,000,000
Test Drives: lognormal with mean of $160,000,000 and standard deviation $16,000,000
Annual market growth factor: triangular with minimum = 2%,maximum = 6%,and most likely = 3%
Annual market share growth rate: triangular with minimum = 15%,maximum = 25%,and most likely = 20%
Use 5,000 trials to generate the simulation model using Crystal Ball.
-In the NPV forecast chart generated after running the simulation,you enter the number 0 in the left range box of the forecast chart and press the enter key.What exactly is the result of the above action?
A) It determines the percentage of risk that the NPV over the five years will not be positive.
B) It determines the probability of a positive NPV value.
C) It determines the cumulative profit over the five year range.
D) It determines the number of trials shown in the NPV forecast chart.
Correct Answer:

Verified
Correct Answer:
Verified
Q12: Latin Hypercube sampling differs from Monte Carlo
Q13: Why is sampling from empirical data not
Q14: Use the data shown below to answer
Q15: Running the Tornado Charts tool before the
Q16: What is Monte Carlo simulation?<br>A)It is the
Q18: Risk analysis seeks to examine the impacts
Q19: Optimum consulting is concerned about the maximum
Q20: Use the data shown below to answer
Q21: Use the data set shown below to
Q22: Explain instances where we have to use