Multiple Choice
Use the data shown below to answer the following question(s) .
Captain Jack Automobiles launched a new car and tabulated the below data for the new launch. 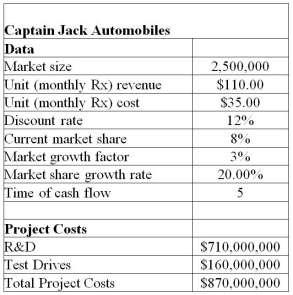 The project manager identified the following distributions and parameters for these variables:
Market size: normal with a mean of 2,000,000 units and a standard deviation of 400,000 units
R&D costs: uniform between $639,000,000 and $781,000,000
Test Drives: lognormal with mean of $160,000,000 and standard deviation $16,000,000
Annual market growth factor: triangular with minimum = 2%,maximum = 6%,and most likely = 3%
Annual market share growth rate: triangular with minimum = 15%,maximum = 25%,and most likely = 20%
Use 5,000 trails to generate the simulation model for NPV using Crystal Ball.
-Using the Tornado Chart tool,determine the assumption that has the greatest impact on the NPV.
A) Market size
B) R&D
C) Test Drives
D) Market growth factor
Correct Answer:

Verified
Correct Answer:
Verified
Q15: Running the Tornado Charts tool before the
Q16: What is Monte Carlo simulation?<br>A)It is the
Q17: Use the data shown below to answer
Q18: Risk analysis seeks to examine the impacts
Q19: Optimum consulting is concerned about the maximum
Q21: Use the data set shown below to
Q22: Explain instances where we have to use
Q23: What is bootstrapping in Crystal Ball?<br>A)It is
Q24: In the analytical approach,if more than one
Q25: In the analytical approach,the probabilities of completing