Multiple Choice
The diagram below shows the budget deficit function for a government in a hypothetical economy. 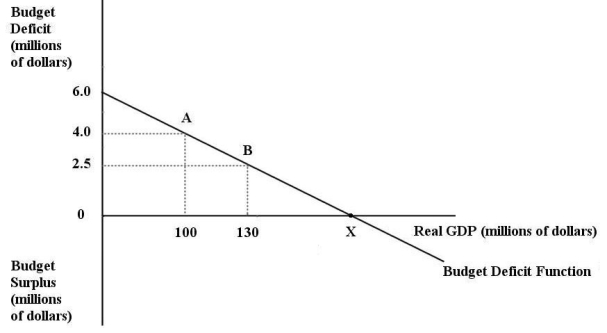 FIGURE 31-1 Refer to Figure 31-1.Initially,suppose real GDP is $100 million and the budget deficit is $4 million,as shown by point A.If the government implements an expansionary fiscal policy by increasing its purchases of goods and services,then
A) the budget deficit function would shift down.
B) the budget deficit function would become steeper.
C) the budget deficit function would become flatter.
D) the budget deficit function would shift up.
E) the size of the budget deficit would decrease as we move from point A to point B.
Correct Answer:

Verified
Correct Answer:
Verified
Q40: Suppose the government's actual budget deficit is
Q41: Suppose the stock of government debt in
Q42: The diagram below shows two budget deficit
Q43: Suppose the real interest rate on government
Q44: The budget deficit function is graphed with
Q46: Consider the budget deficit function.With an unchanged
Q47: The diagram below shows two budget deficit
Q48: The table below shows government purchases (G),net
Q49: The diagram below is for a closed
Q50: The data below provides the Actual and