Multiple Choice
The diagram below shows two budget deficit functions for a hypothetical economy. 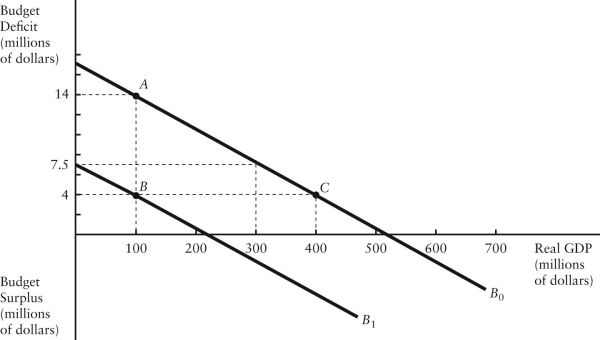 FIGURE 31-2 Refer to Figure 31-2.Initially,suppose real GDP is $100 million and the budget deficit is $14 million,as shown by point A.Which of the following events could result in a move from point A to point C?
A) a fiscal expansion and an increase in GDP
B) a fiscal contraction and an increase in GDP
C) a fiscal expansion and a decrease in GDP
D) a fiscal contraction and a decrease in GDP
E) an increase in GDP with no change in fiscal policy
Correct Answer:

Verified
Correct Answer:
Verified
Q42: The diagram below shows two budget deficit
Q43: Suppose the real interest rate on government
Q44: The budget deficit function is graphed with
Q45: The diagram below shows the budget deficit
Q46: Consider the budget deficit function.With an unchanged
Q48: The table below shows government purchases (G),net
Q49: The diagram below is for a closed
Q50: The data below provides the Actual and
Q51: The diagram below is for a closed
Q52: The diagram below shows two budget deficit