Multiple Choice
The data below provides the Actual and Structural Budget Deficits,as a percentage of real GDP,for Canada between 1999 and 2010.Note that a negative value in the table indicates a budget surplus. 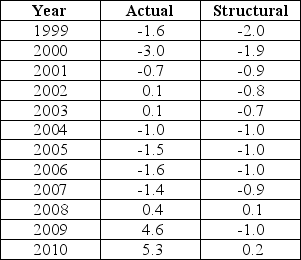 TABLE 31-2 Refer to Table 31-2.Consider the year 2004.Based on the data in the table we can conclude that
A) fiscal policy was expansionary in that year.
B) real output was less than potential in that year.
C) real output was equal to potential in that year.
D) real output was greater than potential in that year.
E) monetary policy was expansionary in that year.
Correct Answer:

Verified
Correct Answer:
Verified
Q45: The diagram below shows the budget deficit
Q46: Consider the budget deficit function.With an unchanged
Q47: The diagram below shows two budget deficit
Q48: The table below shows government purchases (G),net
Q49: The diagram below is for a closed
Q51: The diagram below is for a closed
Q52: The diagram below shows two budget deficit
Q53: The Canadian federal government's net debt as
Q54: The government's structural budget deficit adjusts for<br>A)any
Q55: Transfer payments (such as welfare payments and