Multiple Choice
The three figures below show the phases of a disinflation.In part (i) ,the economy is experiencing a sustained inflation at E1. 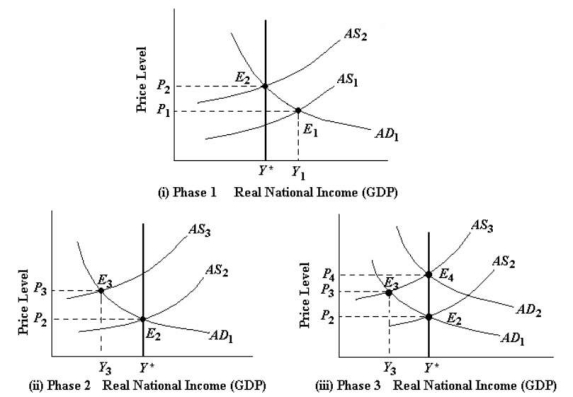 FIGURE 29-4 Refer to Figure 29-4,part (ii) .The upward shift of the AS curve in Phase 2 is normally caused by
A) workers accepting a reduction in their wages.
B) an increase in the productivity of workers.
C) the Bank of Canada engaging in an expansionary monetary policy.
D) an increase in the unemployment rate.
E) inflationary expectations that cause wages to continue rising.
Correct Answer:

Verified
Correct Answer:
Verified
Q87: The first OPEC oil-price shock in 1973
Q88: Suppose economists were able to measure frictional
Q89: The three figures below show the phases
Q90: The three figures below show the phases
Q91: In general,the sacrifice ratio will be smaller,the<br>A)shorter
Q93: A rightward shift in the AD curve
Q94: The three figures below show the phases
Q95: Suppose policymakers are faced with ending a
Q96: Consider the AD/AS model below with a
Q97: Suppose the current inflation rate is 4%