Multiple Choice
The three figures below show the phases of a disinflation.In part (i) ,the economy is experiencing a sustained inflation at E1. 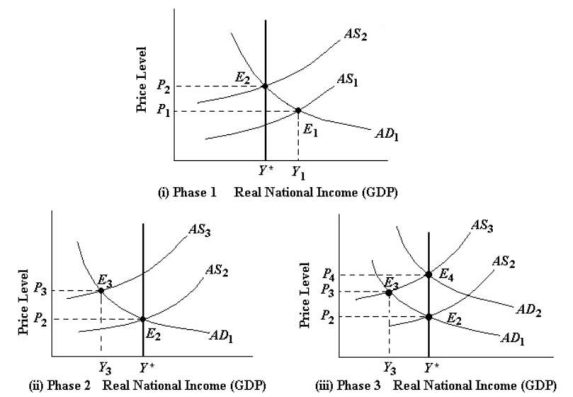 FIGURE 29-4 Refer to Figure 29-4,part (ii) ,Phase 2 of the disinflation process.The upward drift of the AS curve will generally continue longer,with rising unemployment and falling output,when
A) real wages and other factor prices are falling.
B) the price level is falling as a result of the disinflation.
C) firms and consumers regard the central bank's disinflation policy as highly credible.
D) the central bank pursues a contractionary monetary policy even more severe than they had announced.
E) firms and consumers do not regard the central bank's disinflation policy as credible.
Correct Answer:

Verified
Correct Answer:
Verified
Q89: The three figures below show the phases
Q90: The three figures below show the phases
Q91: In general,the sacrifice ratio will be smaller,the<br>A)shorter
Q92: The three figures below show the phases
Q93: A rightward shift in the AD curve
Q95: Suppose policymakers are faced with ending a
Q96: Consider the AD/AS model below with a
Q97: Suppose the current inflation rate is 4%
Q98: Consider the AD/AS model below with a
Q99: Of the three phases involved in the