Multiple Choice
The three figures below show the phases of a disinflation.In part (i) ,the economy is experiencing a sustained inflation at E1. 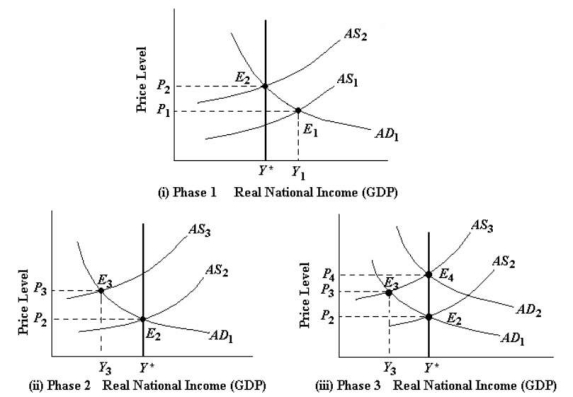 FIGURE 29-4 Refer to Figure 29-4,part (ii) .If the AS curve continues to drift upward during Phase 2 of the disinflation process,the economy will experience
A) falling unemployment and rising output.
B) falling real wages and factor prices and falling unemployment.
C) rising real wages and factor prices and rising employment.
D) rising unemployment and falling output.
E) a falling price level and falling output.
Correct Answer:

Verified
Correct Answer:
Verified
Q84: What does the term NAIRU stand for?<br>A)non-accelerating
Q85: Canada's actual rate of inflation is fairly
Q86: Isolated negative aggregate supply shocks,in the absence
Q87: The first OPEC oil-price shock in 1973
Q88: Suppose economists were able to measure frictional
Q90: The three figures below show the phases
Q91: In general,the sacrifice ratio will be smaller,the<br>A)shorter
Q92: The three figures below show the phases
Q93: A rightward shift in the AD curve
Q94: The three figures below show the phases