Multiple Choice
Figure 2-5 shows monthly average (per unit) production costs for producing Good X. 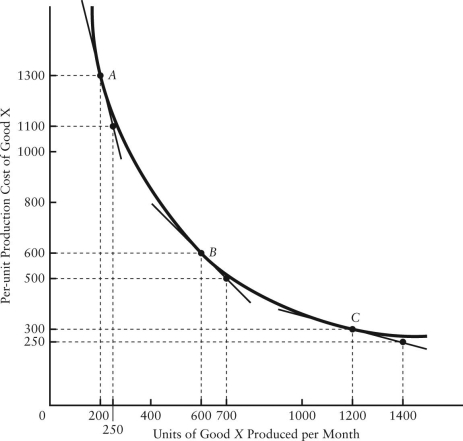 FIGURE 2-5 Refer to Figure 2-5.What is the slope of this non-linear function when 200 units per month are being produced?
A) 4
B) -4
C) 0.25
D) -5.2
E) -0.25
Correct Answer:

Verified
Correct Answer:
Verified
Q91: Suppose there is a linear relationship between
Q92: The table below shows hypothetical data for
Q93: The table below shows hypothetical data for
Q94: When an increase in one variable is
Q95: Suppose there is a theory that several
Q97: The statement that introducing a policy of
Q98: The scientific approach is central to the
Q99: The table below shows hypothetical monthly cell
Q100: <img src="https://d2lvgg3v3hfg70.cloudfront.net/TB7713/.jpg" alt=" FIGURE 2-3 Refer
Q101: The table below shows hypothetical data for