Multiple Choice
The table below shows hypothetical data for volumes of e-books and hardcover books sold over a 3-year period in a particular city. 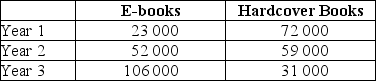 TABLE 2-3 Refer to Table 2-3.Suppose we choose Year 1 as the base year and construct a series of index numbers with which to analyze sales data.The index numbers for volumes of hardcover books sold (starting with Year 1) is
A) 431; 819; 100.
B) 43.1; 81.9; 100.
C) 100; 81.9; 43.1.
D) 100; 0.819; 0.431.
E) 0.431; 0.819; 100.
Correct Answer:

Verified
Correct Answer:
Verified
Q99: The table below shows hypothetical monthly cell
Q100: <img src="https://d2lvgg3v3hfg70.cloudfront.net/TB7713/.jpg" alt=" FIGURE 2-3 Refer
Q101: The table below shows hypothetical data for
Q102: The table below shows hypothetical data for
Q103: In a co-ordinate graph,with Y on the
Q105: What is the best way to display
Q106: An economist has data showing average apartment
Q107: Choose the statement that best characterizes an
Q108: The scientific approach to economic inquiry involves<br>A)choosing
Q109: An assertion about the desirability of reducing