Multiple Choice
The table below shows hypothetical data for the volume of gold and nickel output across several years. 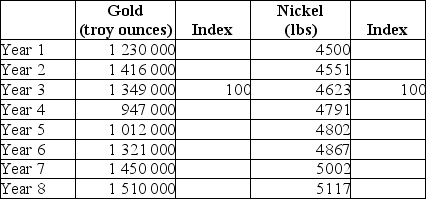 TABLE 2-5 Refer to Table 2-5.What is the index number for nickel output in Year 2?
A) 98.4%
B) 98.4
C) -72.0%
D) 72.0%
E) 0.984%
Correct Answer:

Verified
Correct Answer:
Verified
Q96: Figure 2-5 shows monthly average (per unit)production
Q97: The statement that introducing a policy of
Q98: The scientific approach is central to the
Q99: The table below shows hypothetical monthly cell
Q100: <img src="https://d2lvgg3v3hfg70.cloudfront.net/TB7713/.jpg" alt=" FIGURE 2-3 Refer
Q102: The table below shows hypothetical data for
Q103: In a co-ordinate graph,with Y on the
Q104: The table below shows hypothetical data for
Q105: What is the best way to display
Q106: An economist has data showing average apartment