menu-iconExamlexExamLexServices

Discover

Ask a Question
  1. All Topics
  2. Topic
    Business
  3. Study Set
    Macroeconomics
  4. Exam
    Exam 2: Economic Theories, data, and Graphs
  5. Question
    FIGURE 2-3 Refer to Figure 2-3
Solved

FIGURE 2-3 Refer to Figure 2-3

Question 100

Question 100

Multiple Choice

  FIGURE 2-3 Refer to Figure 2-3.At X<sub>2</sub> on curve A,the A) maximum occurs at Y<sub>1</sub>. B) minimum occurs at Y<sub>4.</sub> C) slope of the curve is zero. D) slope is increasing. E) slope is decreasing. 
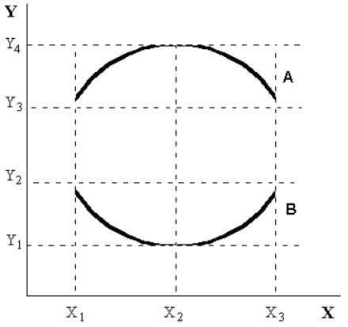
FIGURE 2-3 Refer to Figure 2-3.At X2 on curve A,the


A) maximum occurs at Y1.
B) minimum occurs at Y4.
C) slope of the curve is zero.
D) slope is increasing.
E) slope is decreasing.

Correct Answer:

verifed

Verified

Unlock this answer now
Get Access to more Verified Answers free of charge

Related Questions

Q95: Suppose there is a theory that several

Q96: Figure 2-5 shows monthly average (per unit)production

Q97: The statement that introducing a policy of

Q98: The scientific approach is central to the

Q99: The table below shows hypothetical monthly cell

Q101: The table below shows hypothetical data for

Q102: The table below shows hypothetical data for

Q103: In a co-ordinate graph,with Y on the

Q104: The table below shows hypothetical data for

Q105: What is the best way to display

Examlex

ExamLex

About UsContact UsPerks CenterHomeschoolingTest Prep

Work With Us

Campus RepresentativeInfluencers

Links

FaqPricingChrome Extension

Download The App

Get App StoreGet Google Play

Policies

Privacy PolicyTerms of ServiceHonor CodeCommunity Guidelines

Scan To Download

qr-code

Copyright © (2025) ExamLex LLC.

Privacy PolicyTerms Of ServiceHonor CodeCommunity Guidelines