Multiple Choice
The table below shows the approximate value of Canada's crude oil and natural gas exports over a 5-year period.The amounts shown are billions of dollars. 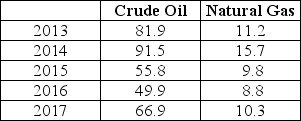 TABLE 2-7 Refer to Table 2-7.Assume that 2013 is the base year,with an index number = 100.What is the index number for the value of natural gas exports in 2017?
A) 0.912
B) 92.0
C) 92.0%
D) 1.09
E) 109.7
Correct Answer:

Verified
Correct Answer:
Verified
Q131: A scatter diagram<br>A)is a graph of a
Q132: The table below shows hypothetical prices for
Q133: Data collected repeatedly over successive periods of
Q134: Economists build models that abstract from the
Q135: At the minimum or the maximum of
Q137: <img src="https://d2lvgg3v3hfg70.cloudfront.net/TB7713/.jpg" alt=" FIGURE 2-2 Refer
Q138: <img src="https://d2lvgg3v3hfg70.cloudfront.net/TB7713/.jpg" alt=" FIGURE 2-4 Refer
Q139: On a coordinate graph with y on
Q140: Choose the statement that best describes how
Q141: Suppose a theory predicts that lowering tuition