Multiple Choice
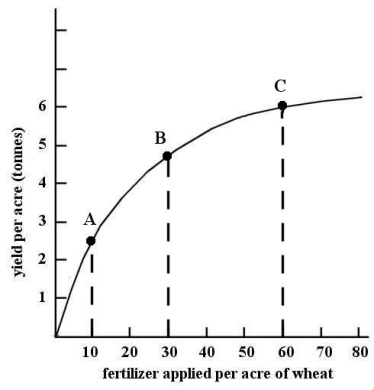 FIGURE 2-4 Refer to Figure 2-4.Suppose we draw a straight line tangent to point B of the non-linear function.The straight line has a slope of 0.075.What information is conveyed to us by this measurement?
A) At point B,the marginal response to the application of 30 units of fertilizer per acre is 0.075 tonnes of wheat.
B) At point B,if one additional unit of fertilizer is applied per acre,the marginal response is 0.075 tonnes of wheat per acre.
C) Because point B is midway between point A and point C,the yield per acre is 0.075 tonnes of wheat when fertilizer applied is between 10 and 60 units per acre.
D) At point B,when fertilizer is applied at a rate of 30 units per acre,the yield is 0.075 tonnes per acre.
E) At point B,the marginal response to the application of 0.075 units of fertilizer is between 4 and 5 tonnes per acre.
Correct Answer:

Verified
Correct Answer:
Verified
Q133: Data collected repeatedly over successive periods of
Q134: Economists build models that abstract from the
Q135: At the minimum or the maximum of
Q136: The table below shows the approximate value
Q137: <img src="https://d2lvgg3v3hfg70.cloudfront.net/TB7713/.jpg" alt=" FIGURE 2-2 Refer
Q139: On a coordinate graph with y on
Q140: Choose the statement that best describes how
Q141: Suppose a theory predicts that lowering tuition
Q142: Which is the best description of a
Q143: <img src="https://d2lvgg3v3hfg70.cloudfront.net/TB7713/.jpg" alt=" FIGURE 2-4 Refer