Multiple Choice
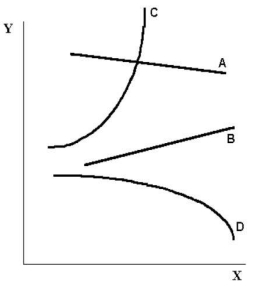 FIGURE 2-2 Refer to Figure 2-2.The slope of curve C is
A) positive and constant.
B) negative and constant.
C) positive and changing.
D) negative and changing.
E) impossible to describe.
Correct Answer:

Verified
Correct Answer:
Verified
Related Questions
Q132: The table below shows hypothetical prices for
Q133: Data collected repeatedly over successive periods of
Q134: Economists build models that abstract from the
Q135: At the minimum or the maximum of
Q136: The table below shows the approximate value
Q138: <img src="https://d2lvgg3v3hfg70.cloudfront.net/TB7713/.jpg" alt=" FIGURE 2-4 Refer
Q139: On a coordinate graph with y on
Q140: Choose the statement that best describes how
Q141: Suppose a theory predicts that lowering tuition
Q142: Which is the best description of a