Multiple Choice
The graph on the left shows the short-run marginal cost curve for a typical firm selling in a perfectly competitive industry.The graph on the right shows current industry demand and supply. 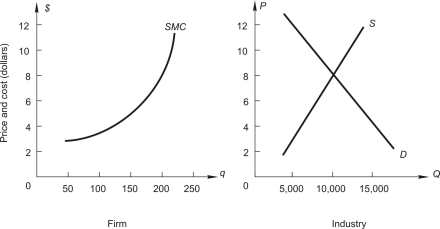 What is the marginal revenue for the FIRM from selling the 250th unit of output?
A) $10
B) $8
C) $6
D) $4
E) zero
Correct Answer:

Verified
Correct Answer:
Verified
Q71: A firm in a competitive industry faces
Q72: A consulting company estimated market demand
Q73: Sport Tee Corporation manufactures T-shirts bearing
Q74: In order to minimize losses in the
Q75: Suits Only,a dry-cleaning firm that specializes in
Q77: In a perfectly competitive market,<br>A)a firm can
Q78: <img src="https://d2lvgg3v3hfg70.cloudfront.net/TB7882/.jpg" alt=" The graph above
Q79: Radon Research Corporation (RRC)is one of
Q80: The graph below shows demand and marginal
Q81: Firms that employ exceptionally productive resources<br>A)have lower