Multiple Choice
The graph below shows demand and marginal cost for a perfectly competitive firm.If the firm is producing 300 units of output,decreasing output by one unit would ______ the firm's profit by $______. 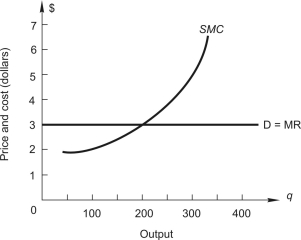
A) decrease,$2
B) increase,$2
C) increase,$3
D) decrease,$5
E) increase,$5
Correct Answer:

Verified
Correct Answer:
Verified
Q75: Suits Only,a dry-cleaning firm that specializes in
Q76: The graph on the left shows the
Q77: In a perfectly competitive market,<br>A)a firm can
Q78: <img src="https://d2lvgg3v3hfg70.cloudfront.net/TB7882/.jpg" alt=" The graph above
Q79: Radon Research Corporation (RRC)is one of
Q81: Firms that employ exceptionally productive resources<br>A)have lower
Q82: Which of the following is NOT a
Q83: Radon Research Corporation (RRC)is one of
Q84: Consider a competitive industry and a
Q85: <img src="https://d2lvgg3v3hfg70.cloudfront.net/TB7882/.jpg" alt=" The graph above