Multiple Choice
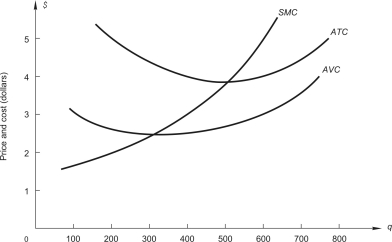 The graph above shows cost curves for a perfectly competitive firm.If market price is $5,how much output will the firm produce?
A) 0 units
B) 200 units.
C) 500 units.
D) 600 units
Correct Answer:

Verified
Correct Answer:
Verified
Related Questions
Q73: Sport Tee Corporation manufactures T-shirts bearing
Q74: In order to minimize losses in the
Q75: Suits Only,a dry-cleaning firm that specializes in
Q76: The graph on the left shows the
Q77: In a perfectly competitive market,<br>A)a firm can
Q79: Radon Research Corporation (RRC)is one of
Q80: The graph below shows demand and marginal
Q81: Firms that employ exceptionally productive resources<br>A)have lower
Q82: Which of the following is NOT a
Q83: Radon Research Corporation (RRC)is one of