Multiple Choice
Below,the graph on the left shows the short-run cost curves for a firm in a perfectly competitive market,and the graph on the right shows the current market conditions in this industry.In order to maximize profit,how much output should the firm produce? 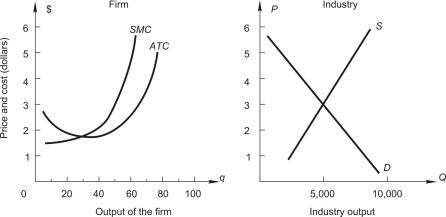
A) 20 units
B) 40 units
C) 50 units
D) 60 units
E) 80 units
Correct Answer:

Verified
Correct Answer:
Verified
Q86: Below,the graph on the left shows the
Q87: The table below shows a competitive
Q88: In a perfectly competitive market<br>A)a firm must
Q89: Sport Tee Corporation manufactures T-shirts bearing
Q90: Below,the graph on the left shows long-run
Q92: In long-run competitive equilibrium it is possible
Q93: In a competitive industry the market-determined price
Q94: Consider a competitive industry and a
Q95: In a perfectly competitive industry the market
Q96: Which of the following is NOT a