Multiple Choice
Below,the graph on the left shows the short-run marginal cost curve for a typical firm selling in a perfectly competitive industry.The graph on the right shows current industry demand and supply. 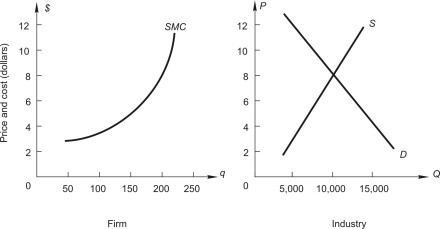 If the firm's demand and marginal revenue curves were drawn in the left-hand graph,what would be the elasticity of demand?
A) zero
B) -6
C) -0.6
D) infinitely elastic
E) unitary
Correct Answer:

Verified
Correct Answer:
Verified
Q81: Firms that employ exceptionally productive resources<br>A)have lower
Q82: Which of the following is NOT a
Q83: Radon Research Corporation (RRC)is one of
Q84: Consider a competitive industry and a
Q85: <img src="https://d2lvgg3v3hfg70.cloudfront.net/TB7882/.jpg" alt=" The graph above
Q87: The table below shows a competitive
Q88: In a perfectly competitive market<br>A)a firm must
Q89: Sport Tee Corporation manufactures T-shirts bearing
Q90: Below,the graph on the left shows long-run
Q91: Below,the graph on the left shows the