Multiple Choice
Below,the graph on the left shows long-run average and marginal cost for a typical firm in a perfectly competitive industry.The graph on the right shows demand and long-run supply for an increasing-cost industry. 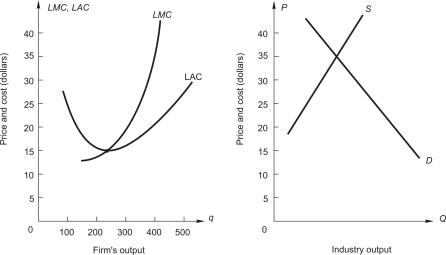 If this were a constant-cost industry,what would be the price when the industry gets to long-run competitive equilibrium?
A) between $35 and $20
B) $35
C) $20
D) below $20
E) above $35
Correct Answer:

Verified
Correct Answer:
Verified
Q85: <img src="https://d2lvgg3v3hfg70.cloudfront.net/TB7882/.jpg" alt=" The graph above
Q86: Below,the graph on the left shows the
Q87: The table below shows a competitive
Q88: In a perfectly competitive market<br>A)a firm must
Q89: Sport Tee Corporation manufactures T-shirts bearing
Q91: Below,the graph on the left shows the
Q92: In long-run competitive equilibrium it is possible
Q93: In a competitive industry the market-determined price
Q94: Consider a competitive industry and a
Q95: In a perfectly competitive industry the market