Multiple Choice
Refer to the following figure.The price of capital is $50 per unit: 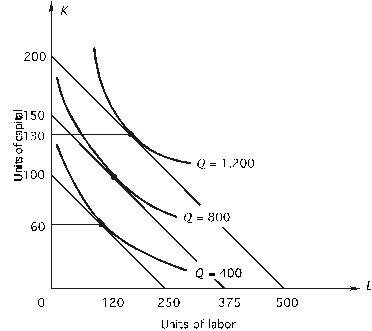 What is the marginal rate of technical substitution at each cost minimizing equilibrium point?
A) 0.80
B) 0.40
C) 2.50
D) 2.00
E) impossible to tell without marginal products
Correct Answer:

Verified
Correct Answer:
Verified
Q79: If a firm is producing the level
Q80: expansion path shows how<br>A)input prices change as
Q81: In the following graph,the price of labor
Q82: Refer to the following graph.The price of
Q83: If there are no fixed costs in
Q84: In the following graph,the price of capital
Q85: <img src="https://d2lvgg3v3hfg70.cloudfront.net/TB7882/.jpg" alt=" Given the above
Q86: In the following graph,the price of capital
Q88: <img src="https://d2lvgg3v3hfg70.cloudfront.net/TB7882/.jpg" alt=" In the above
Q89: Economies of scale exist when<br>A)total cost decreases