Multiple Choice
In the following graph,the price of capital is $100 per unit.Which of the following combinations of capital and labor lies on the expansion path? 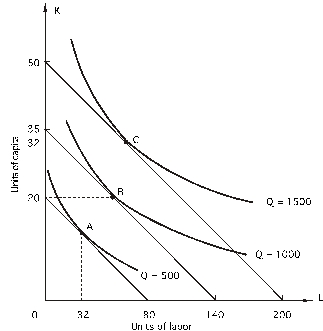
A) 20K,60L
B) 35K,140L
C) 50K,200L
D) all of the above
E) none of the above
Correct Answer:

Verified
Correct Answer:
Verified
Q79: If a firm is producing the level
Q80: expansion path shows how<br>A)input prices change as
Q81: In the following graph,the price of labor
Q82: Refer to the following graph.The price of
Q83: If there are no fixed costs in
Q85: <img src="https://d2lvgg3v3hfg70.cloudfront.net/TB7882/.jpg" alt=" Given the above
Q86: In the following graph,the price of capital
Q87: Refer to the following figure.The price of
Q88: <img src="https://d2lvgg3v3hfg70.cloudfront.net/TB7882/.jpg" alt=" In the above
Q89: Economies of scale exist when<br>A)total cost decreases