Multiple Choice
In the following graph,the price of capital is $100 per unit; the price of labor is $25 per unit.When output is 20 units,what is AVERAGE cost? 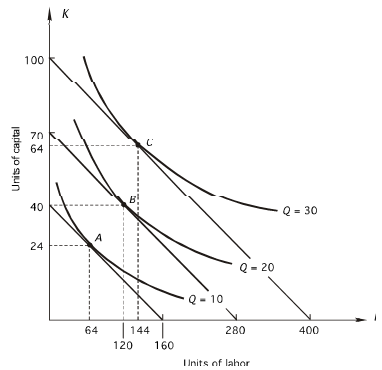
A) $350
B) $700
C) $3,500
D) $7,000
E) none of the above
Correct Answer:

Verified
Correct Answer:
Verified
Q79: If a firm is producing the level
Q80: expansion path shows how<br>A)input prices change as
Q81: In the following graph,the price of labor
Q82: Refer to the following graph.The price of
Q83: If there are no fixed costs in
Q84: In the following graph,the price of capital
Q85: <img src="https://d2lvgg3v3hfg70.cloudfront.net/TB7882/.jpg" alt=" Given the above
Q87: Refer to the following figure.The price of
Q88: <img src="https://d2lvgg3v3hfg70.cloudfront.net/TB7882/.jpg" alt=" In the above
Q89: Economies of scale exist when<br>A)total cost decreases