Multiple Choice
Refer to the following graph.The price of capital (r) is $20. 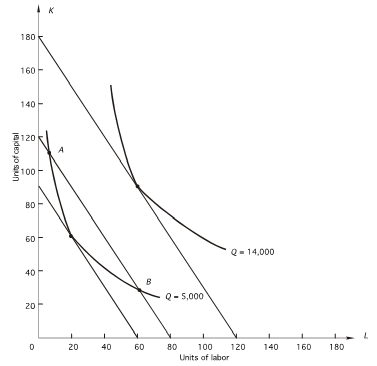 What combination of K and L should the firm choose to produce 14,000 units of output at the lowest cost?
A) 180K,120L
B) 180K,0L
C) 60K,120L
D) 90K,60L
E) none of the above
Correct Answer:

Verified
Correct Answer:
Verified
Related Questions
Q2: A publishing house is using 400 printers
Q3: In the following graph,the price of labor
Q4: In the graph below,the price of capital
Q5: If the price of labor is $5
Q6: A cow will produce 8500 lbs.of milk
Q7: Refer to the following figure.The price of
Q8: Refer to the following graph.The price of
Q9: In the graph below,the price of capital
Q10: If the marginal rate of technical substitution
Q11: Following is a firm's expansion path.The