Multiple Choice
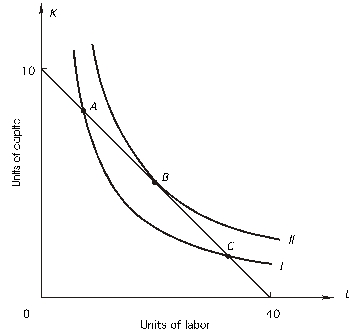 Given the above graph,as you move from input combination A to input combination C,
A) output is unchanged.
B) cost is unchanged.
C) the marginal rate of technical substitution increases.
D) both a and b
E) all of the above
Correct Answer:

Verified
Correct Answer:
Verified
Related Questions
Q11: Following is a firm's expansion path.The
Q12: In the following graph,the price of capital
Q13: Suppose that when a firm increases output
Q14: Refer to the following graph.The price of
Q15: The marginal rate of technical substitution is<br>A)the
Q17: <img src="https://d2lvgg3v3hfg70.cloudfront.net/TB7882/.jpg" alt=" In the above
Q18: A firm is using 500 units of
Q19: Refer to the following graph.The price of
Q20: producer is hiring 20 units of labor
Q21: Refer to the following figure.The price of