Multiple Choice
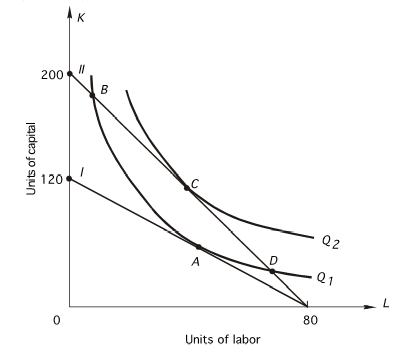 In the above graph,the shift from I to II was due to
A) an increase in total cost.
B) an increase in the price of labor.
C) a decrease in the price of labor.
D) an increase in the price of capital.
E) a decrease in the price of capital.
Correct Answer:

Verified
Correct Answer:
Verified
Q12: In the following graph,the price of capital
Q13: Suppose that when a firm increases output
Q14: Refer to the following graph.The price of
Q15: The marginal rate of technical substitution is<br>A)the
Q16: <img src="https://d2lvgg3v3hfg70.cloudfront.net/TB7882/.jpg" alt=" Given the above
Q18: A firm is using 500 units of
Q19: Refer to the following graph.The price of
Q20: producer is hiring 20 units of labor
Q21: Refer to the following figure.The price of
Q22: Refer to the following graph.The price of