Multiple Choice
In the following graph,the price of capital is $100 per unit.What is the marginal rate of technical substitution at point C?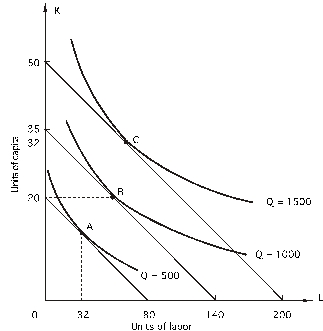
A) 0.14
B) 0.4
C) 1.4
D) 4
E) none of the above
Correct Answer:

Verified
Correct Answer:
Verified
Related Questions
Q7: Refer to the following figure.The price of
Q8: Refer to the following graph.The price of
Q9: In the graph below,the price of capital
Q10: If the marginal rate of technical substitution
Q11: Following is a firm's expansion path.The
Q13: Suppose that when a firm increases output
Q14: Refer to the following graph.The price of
Q15: The marginal rate of technical substitution is<br>A)the
Q16: <img src="https://d2lvgg3v3hfg70.cloudfront.net/TB7882/.jpg" alt=" Given the above
Q17: <img src="https://d2lvgg3v3hfg70.cloudfront.net/TB7882/.jpg" alt=" In the above