Multiple Choice
In the following graph the price of Y is $15.What does the curve in the lower graph show? 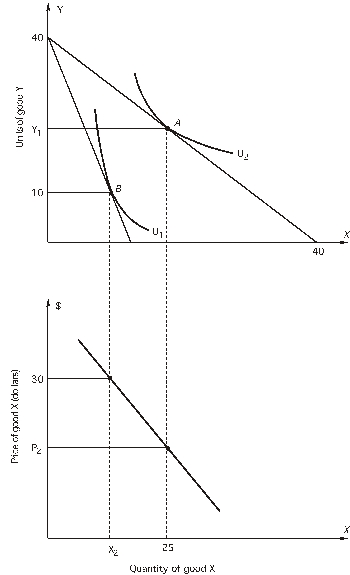
A) how a consumer's utility-maximizing choices of X and Y change when the budget constraint changes
B) how a consumer's preferences change when income changes
C) how a consumer's utility-maximizing choices of X changes when the price of X changes
D) how a consumer's utility-maximizing choices of Y changes when the price of Y changes
E) both c and d
Correct Answer:

Verified
Correct Answer:
Verified
Q74: Based on the following graph,at point C,
Q75: A consumer has the indifference map shown
Q76: The following figure shows a portion of
Q77: In the figure below,a consumer faces a
Q78: The figure below shows a consumer maximizing
Q80: In the following graph the price of
Q81: What is the equation for budget line
Q82: A consumer has the indifference map shown
Q83: A market demand curve<br>A)is the horizontal summation
Q84: In the following graph the price of