Multiple Choice
The following figure shows a portion of a consumer's indifference map and budget lines.The price of good Y is $7 and the consumer's income is $700.Let the consumer begin in utility-maximizing equilibrium at point A on indifference curve I.Next the price of good X changes so that the consumer moves to a new utility-maximizing equilibrium at point B on indifference curve II.The total effect of the change in the price of X is 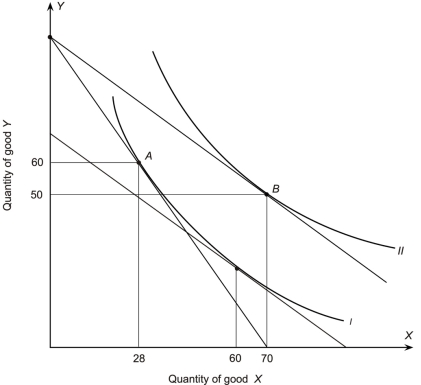
A) +12
B) +10
C) -10
D) +32
E) +42
Correct Answer:

Verified
Correct Answer:
Verified
Q71: In a world with only two goods
Q72: In the following graph the price
Q73: If the marginal rate of substitution of
Q74: Based on the following graph,at point C,
Q75: A consumer has the indifference map shown
Q77: In the figure below,a consumer faces a
Q78: The figure below shows a consumer maximizing
Q79: In the following graph the price of
Q80: In the following graph the price of
Q81: What is the equation for budget line