Multiple Choice
The figure below shows a consumer maximizing utility at two different prices (the left panel) and the consumer's demand for good X at the same two prices of good X (the right panel) .The price of good Y is $4.50.When the price of X increases from point S to point R along the demand curve,$___________ of income must be temporarily given to the consumer to isolate the substitution effect. 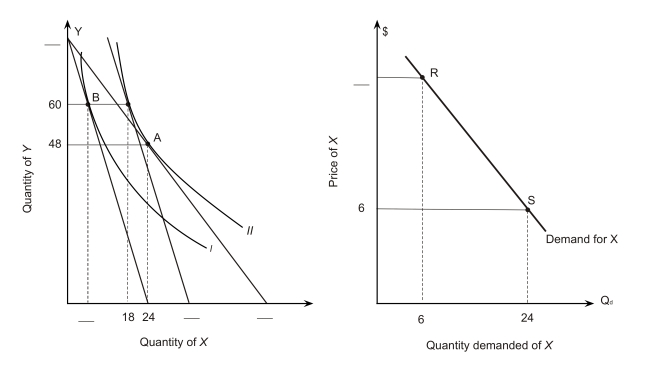
A) $175
B) $180
C) $200
D) $360
E) $400
Correct Answer:

Verified
Correct Answer:
Verified
Q73: If the marginal rate of substitution of
Q74: Based on the following graph,at point C,
Q75: A consumer has the indifference map shown
Q76: The following figure shows a portion of
Q77: In the figure below,a consumer faces a
Q79: In the following graph the price of
Q80: In the following graph the price of
Q81: What is the equation for budget line
Q82: A consumer has the indifference map shown
Q83: A market demand curve<br>A)is the horizontal summation