Multiple Choice
The figure below shows a consumer maximizing utility at two different prices (the left panel) and the consumer's demand for good X at the same two prices of good X (the right panel) .The price of good Y is $14.When the price of X increases from point M to point N along the demand curve,the income effect of the price increase is ________. 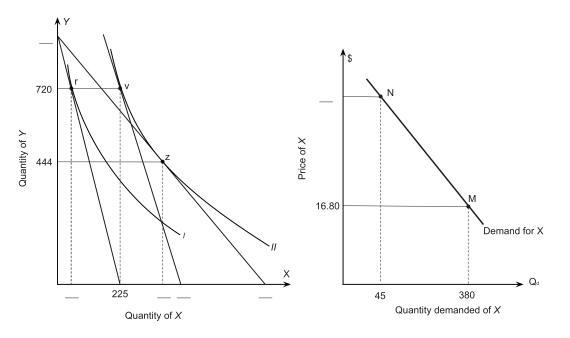
A) 175
B) 180
C) -175
D) -180
E) none of the above
Correct Answer:

Verified
Correct Answer:
Verified
Q1: An individual's demand curve for X<br>A)shows how
Q2: The rate at which a consumer is
Q3: The figure below shows a consumer maximizing
Q5: Suppose that utility-maximizing consumers in San Francisco
Q6: Assume James purchases only two goods,steak and
Q7: Which of the following is NOT a
Q8: The figure below shows a consumer maximizing
Q9: Assume James purchases only two goods,steak and
Q10: The following figure shows a portion of
Q11: In the following graph the consumer's income