Multiple Choice
The figure below shows a consumer maximizing utility at two different prices (the left panel) and the consumer's demand for good X at the same two prices of good X (the right panel) .The price of good Y is $4.50.When the price of X increases from point S to point R along the demand curve,the total effect of the price increase is ________. 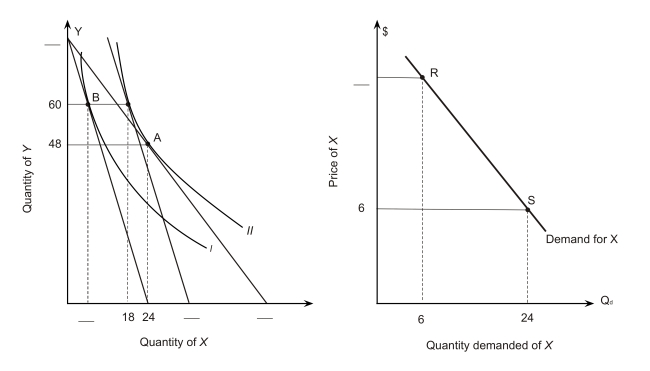
A) +2
B) +2.5
C) -15.5
D) -18
E) -21
Correct Answer:

Verified
Correct Answer:
Verified
Q38: The figure below shows a consumer maximizing
Q39: Mary prefers bananas to plums and plums
Q40: The following figure shows a portion of
Q41: In the following graph the consumer's income
Q42: slope of an indifference curve<br>A)shows the change
Q44: Marginal utility is<br>A)the utility obtained from the
Q45: In the following graph the price
Q46: Ronald,who consumes only hamburgers and hot dogs,has
Q47: What is the equation for budget line
Q48: The price of X is $20 and