Multiple Choice
The figure below shows a consumer maximizing utility at two different prices (the left panel) and the consumer's demand for good X at the same two prices of good X (the right panel) .The price of good Y is $4.50.What is the consumer's income? 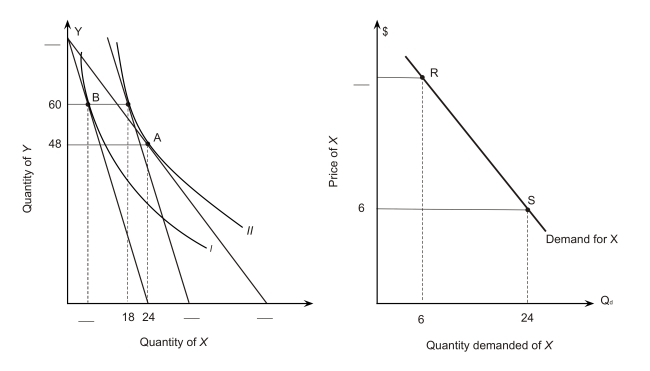
A) $250
B) $280
C) $320
D) $360
E) $400
Correct Answer:

Verified
Correct Answer:
Verified
Q33: The figure below shows a consumer maximizing
Q34: utility function<br>A)shows the relation between prices and
Q35: Market demand<br>A)is the horizontal summation of the
Q36: The figure below shows a consumer maximizing
Q37: The following figure shows a portion of
Q39: Mary prefers bananas to plums and plums
Q40: The following figure shows a portion of
Q41: In the following graph the consumer's income
Q42: slope of an indifference curve<br>A)shows the change
Q43: The figure below shows a consumer maximizing