Multiple Choice
The following figure shows a portion of a consumer's indifference map and budget lines.The price of good Y is $7 and the consumer's income is $700.Let the consumer begin in utility-maximizing equilibrium at point A on indifference curve I.Next the price of good X changes so that the consumer moves to a new utility-maximizing equilibrium at point B on indifference curve II.Good X is a(an) ___________ good and thus cannot be a _________ good. 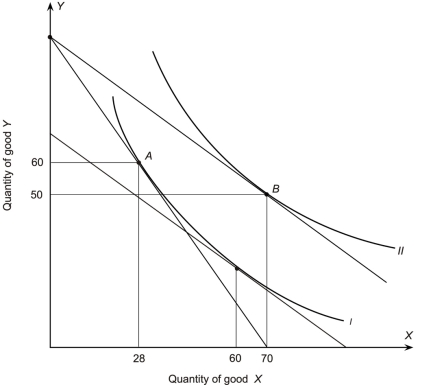
A) normal; Giffen
B) inferior; Giffen
C) substitute; Giffen
D) Giffen; normal
E) Giffen; substitute
Correct Answer:

Verified
Correct Answer:
Verified
Q35: Market demand<br>A)is the horizontal summation of the
Q36: The figure below shows a consumer maximizing
Q37: The following figure shows a portion of
Q38: The figure below shows a consumer maximizing
Q39: Mary prefers bananas to plums and plums
Q41: In the following graph the consumer's income
Q42: slope of an indifference curve<br>A)shows the change
Q43: The figure below shows a consumer maximizing
Q44: Marginal utility is<br>A)the utility obtained from the
Q45: In the following graph the price