Multiple Choice
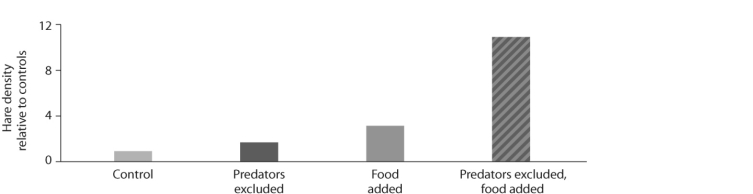 Figure 51.13
-Looking at the data in the figure above from the hare/lynx experiment, what conclusion can you draw?
A) Hares control lynx population size.
B) Lynx and hare populations are independent of each other.
C) Lynx control hare population size.
D) Hare populations are limited by both predation and food availability.
Correct Answer:

Verified
Correct Answer:
Verified
Q2: <img src="https://d2lvgg3v3hfg70.cloudfront.net/TB6548/.jpg" alt="
Q3: Which of the following is the most
Q4: <img src="https://d2lvgg3v3hfg70.cloudfront.net/TB6548/.jpg" alt=" Figure 51.1 -In
Q5: <img src="https://d2lvgg3v3hfg70.cloudfront.net/TB6548/.jpg" alt=" Figure 51.3 -Looking
Q6: (a)<br><img src="https://d2lvgg3v3hfg70.cloudfront.net/TB6548/.jpg" alt="(a) (b)
Q7: The definition of a generation is<br>A) 20
Q8: What is the primary limiting factor that
Q9: Use the following abstract from Theoretical Population
Q10: (a) Density dependence: Growth rate slows at
Q11: <img src="https://d2lvgg3v3hfg70.cloudfront.net/TB6548/.jpg" alt=" Figure 51.1 -In