Multiple Choice
The diagram below shows an AD/AS model for a hypothetical economy.The economy begins in long-run equilibrium at point A. 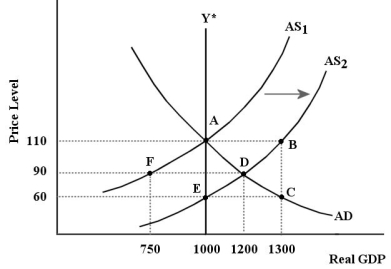 FIGURE 24-4
-Refer to Figure 24-4.Following the positive AS shock shown in the diagram,the adjustment process will take the economy to a long-run equilibrium where the price level is ________ and real GDP is ________.
A) 60; 1000
B) 60; 1300
C) 90; 750
D) 90; 1200
E) 110; 1000
Correct Answer:

Verified
Correct Answer:
Verified
Q17: The diagram below shows an AD/AS model
Q19: When we study the adjustment process in
Q21: <img src="https://d2lvgg3v3hfg70.cloudfront.net/TB5441/.jpg" alt=" FIGURE 24-1 -Refer
Q23: Suppose that the economy is initially in
Q25: Suppose the economy is experiencing an inflationary
Q25: The table below shows data for five
Q26: The diagram below shows an AD/AS model
Q111: Suppose the economy begins in a long-run
Q130: In the basic AD/AS macro model,permanent increases
Q146: Which of the following would occur as