Multiple Choice
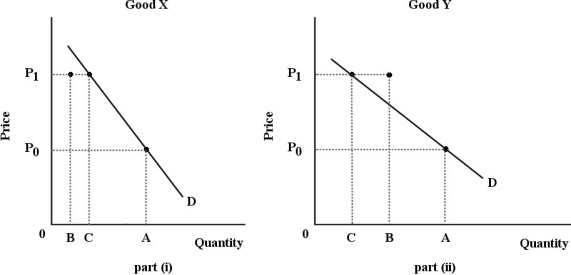 FIGURE 6-5
-Refer to Figure 6-5. For both goods, the price increases from P0 to P1. The substitution effect is illustrated by the change in quantity demanded from A to B; the income effect is illustrated by the change in quantity demanded from B to C. Good Y is certainly an) good.
A) inferior
B) normal
C) luxury
D) necessity
E) Giffen
Correct Answer:

Verified
Correct Answer:
Verified
Q1: The figures below show Chris's consumption of
Q54: If all consumers in an economy have
Q81: An indifference curve plotted for two different
Q101: <img src="https://d2lvgg3v3hfg70.cloudfront.net/TB5441/.jpg" alt=" FIGURE 6-2 -Refer
Q102: The "law" of diminishing marginal utility implies
Q104: <img src="https://d2lvgg3v3hfg70.cloudfront.net/TB7542/.jpg" alt=" FIGURE 6-7 -Refer
Q117: A consumer maximizes his or her utility
Q127: Assume you are consuming two goods,X and
Q129: Suppose a utility-maximizing person consumes only two
Q131: <img src="https://d2lvgg3v3hfg70.cloudfront.net/TB5441/.jpg" alt=" FIGURE 6-9 -Refer