Multiple Choice
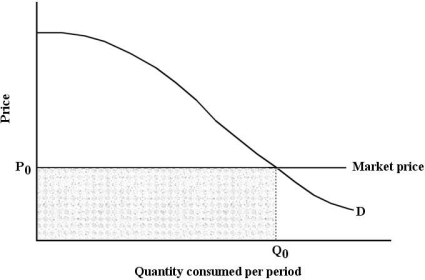 FIGURE 6-7
-Refer to Figure 6-7. Suppose that price is P0. Total consumer surplus is then given by the area
A) under the demand curve to the left of Q0.
B) below P0 and to the left of Q0.
C) under the demand curve to the left of Q0, but above P0.
D) under the entire demand curve.
E) above the market price.
Correct Answer:

Verified
Correct Answer:
Verified
Q1: The figures below show Chris's consumption of
Q54: If all consumers in an economy have
Q62: Suppose there are only two goods,A and
Q101: <img src="https://d2lvgg3v3hfg70.cloudfront.net/TB7542/.jpg" alt=" FIGURE 6-2 -Refer
Q107: <img src="https://d2lvgg3v3hfg70.cloudfront.net/TB7542/.jpg" alt=" FIGURE 6-5 -Refer
Q116: Economists use the term "marginal utility" to
Q117: A consumer maximizes his or her utility
Q127: Assume you are consuming two goods,X and
Q129: Suppose a utility-maximizing person consumes only two
Q131: <img src="https://d2lvgg3v3hfg70.cloudfront.net/TB5441/.jpg" alt=" FIGURE 6-9 -Refer