Multiple Choice
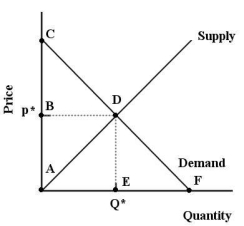
 FIGURE 6-6
-Refer to Figure 6-6.Suppose the market price is p*.In this case,the total value consumers place on consuming Q* units is outlined by the area
A) BCD.
B) ABD.
C) ADE.
D) ACDE.
E) ABDF.
Correct Answer:

Verified
Correct Answer:
Verified
Related Questions
Q43: The figures below show Chris's consumption of
Q44: A demand curve for a normal good
Q45: The table below shows the total value
Q46: When a consumer's marginal rate of substitution
Q47: The table below shows the total value
Q49: The table below shows the total value
Q50: In which of the following situations will
Q51: If money income is reduced by half,and
Q52: 6A-4 Deriving the Demand Curve<br>-Refer to Figure
Q53: 6A-5 Income and Substitution Effects <img src="https://d2lvgg3v3hfg70.cloudfront.net/TB5441/.jpg"