Multiple Choice
Figure 2-5 shows monthly average (per unit) production costs for producing Good X. 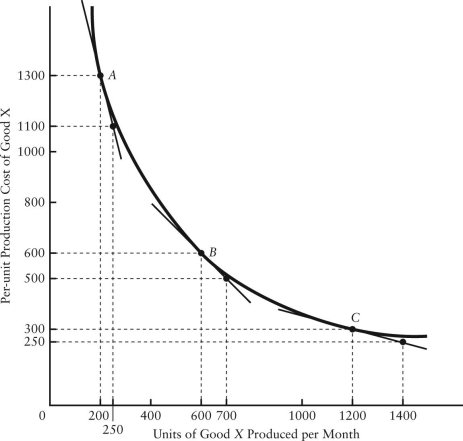 FIGURE 2-5
-Refer to Figure 2-5.What is the slope of this non-linear function when 1200 units per month are being produced?
A) 0.25
B) -0.25
C) 4
D) -4
E) -2
Correct Answer:

Verified
Correct Answer:
Verified
Q4: Which of the following statements belongs more
Q6: The table below shows hypothetical per-minute cell
Q7: The table below shows the approximate value
Q11: The table below shows hypothetical prices for
Q13: <img src="https://d2lvgg3v3hfg70.cloudfront.net/TB5441/.jpg" alt=" FIGURE 2-2 -Refer
Q27: On a coordinate graph with y on
Q47: An economist has data showing household income
Q116: Which is the best description of positive
Q144: Choose the statement that best characterizes an
Q147: When an increase in one variable is