Multiple Choice
Use the figure below to answer the following questions.
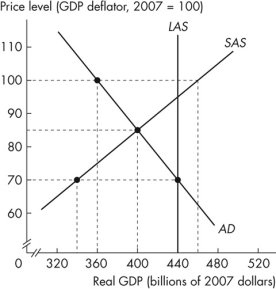 Figure 10.3.1
-Refer to Figure 10.3.1.The economy is at its short- run macroeconomic equilibrium.There is a difference between _______ equilibrium real GDP and potential GDP of $_______ billion.
A) below full- employment; 20
B) actual; 0
C) below full- employment; 40
D) above full- employment; 40
E) above full- employment; 20
Correct Answer:

Verified
Correct Answer:
Verified
Q38: Use the figure below to answer the
Q39: Everything else remaining the same, an increase
Q40: Use the figure below to answer the
Q41: Use the figure below to answer the
Q42: Which of the following situations illustrates how
Q44: Use the figure below to answer the
Q45: Use the figure below to answer the
Q46: The long- run aggregate supply curve is
Q47: The world goes into an expansion.Starting from
Q48: Which of the following will lower the