Multiple Choice
Use the figure below to answer the following questions.
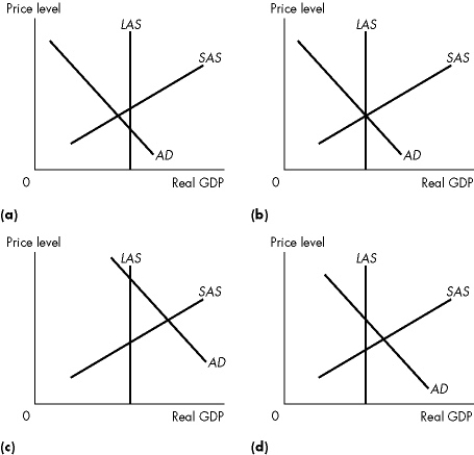 Figure 10.3.3
-Refer to Figure 10.3.3.Which of the graphs illustrates a full- employment equilibrium?
A) a only
B) b only
C) c only
D) d only
E) c and d
Correct Answer:

Verified
Correct Answer:
Verified
Related Questions
Q33: Disposable income is aggregate income<br>A)minus fixed expenses
Q34: Use the table below to answer the
Q35: Aggregate demand<br>A)measures the amount of a nation's
Q36: Suppose that the E.U.economy goes into an
Q37: Use the figure below to answer the
Q39: Everything else remaining the same, an increase
Q40: Use the figure below to answer the
Q41: Use the figure below to answer the
Q42: Which of the following situations illustrates how
Q43: Use the figure below to answer the