Multiple Choice
Use the figure below to answer the following questions.
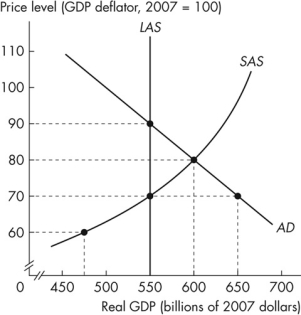 Figure 10.3.2
-Refer to Figure 10.3.2.If the economy automatically adjusts to long- run equilibrium, then
A) the actual unemployment rate exceeds the natural unemployment rate.
B) real GDP is $600 billion.
C) the SAS curve shifts rightward.
D) the price level rises to 90.
E) potential GDP decreases.
Correct Answer:

Verified
Correct Answer:
Verified
Q36: Suppose that the E.U.economy goes into an
Q37: Use the figure below to answer the
Q38: Use the figure below to answer the
Q39: Everything else remaining the same, an increase
Q40: Use the figure below to answer the
Q42: Which of the following situations illustrates how
Q43: Use the figure below to answer the
Q44: Use the figure below to answer the
Q45: Use the figure below to answer the
Q46: The long- run aggregate supply curve is